Case study
LinkyStat
Data pipeline · Time-series · Long-term
GitHubCapture, store and visualise electricity consumption from the Linky meter.
A Linky meter, "connected". You've got my attention. Connected how, exactly?
The Enedis TIC spec, fine. A little USB key from hallard.me to read the serial frame, and now I'm on home ground: software. I can read the telemetry (TIC). One frame, one checksum to validate. I've got my first data.
Drop it all into a database, Grafana on top, and let it accumulate. Not a real-time gadget: long memory, usable over years.
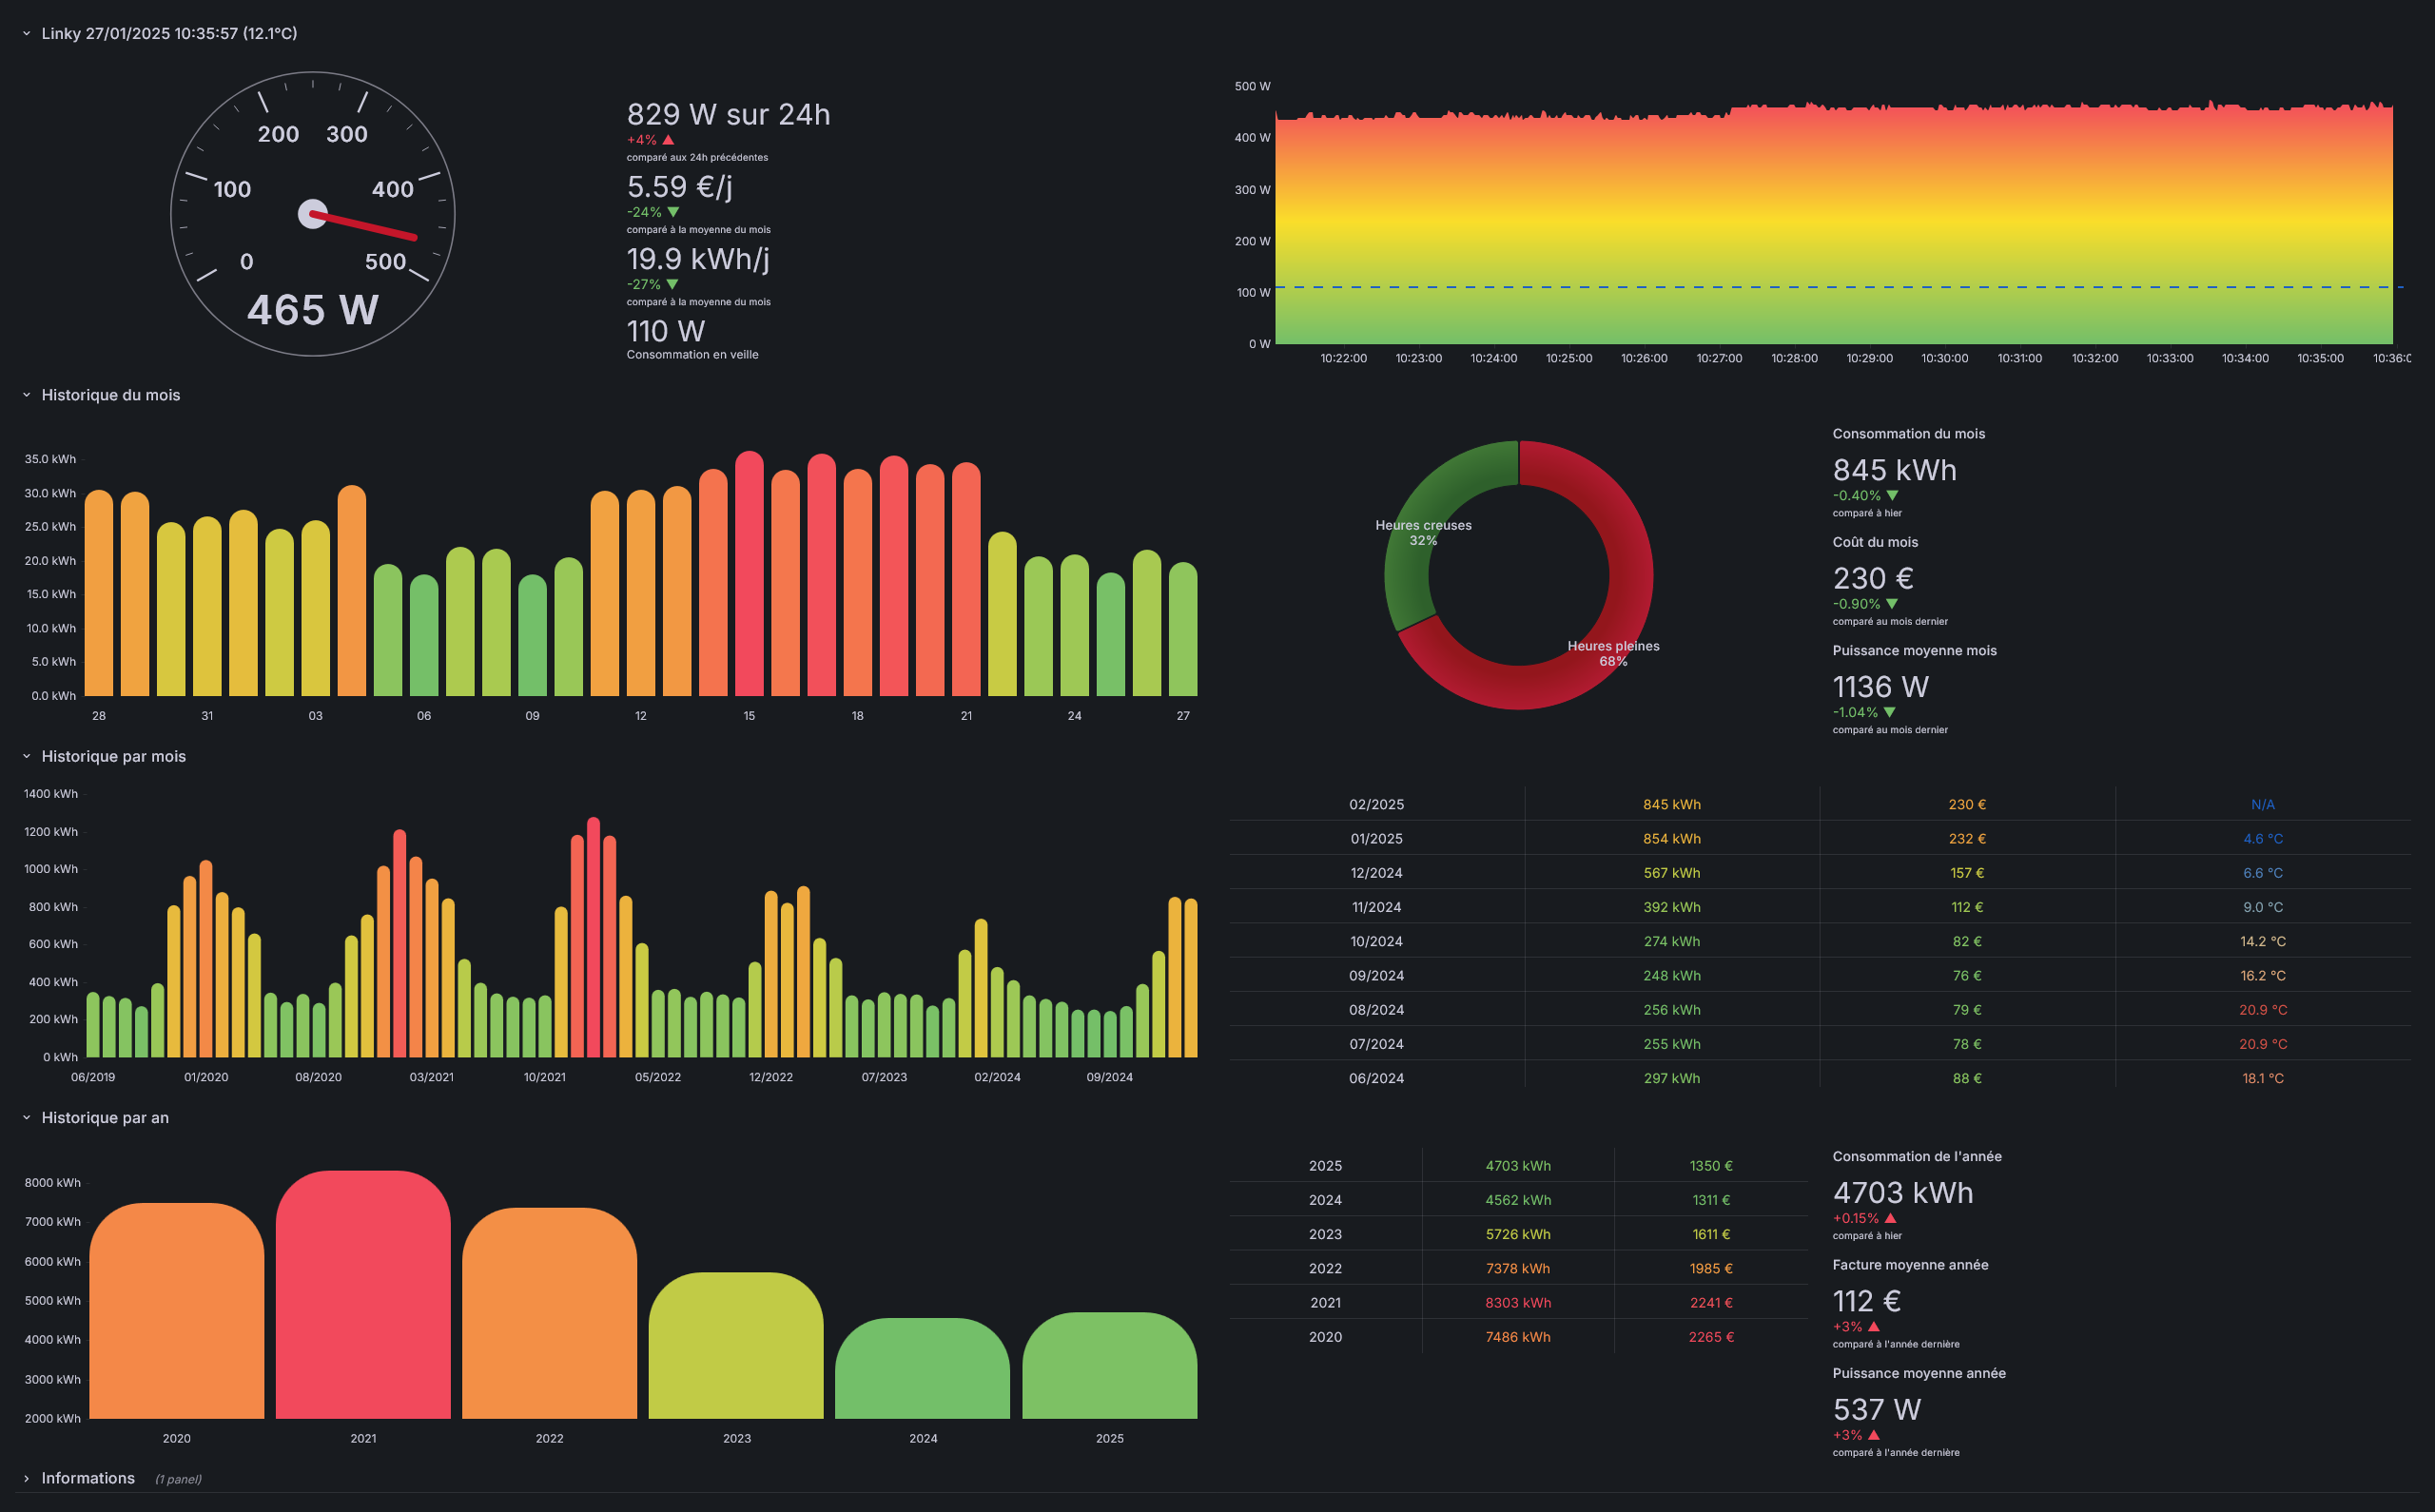
In continuous production since day one. Unbroken history until the switch to Home Assistant.
A plain relational schema: no cardinality blow-up, no complex retention (full real-time for 2 days, hourly history for 7 years), queries still readable years later.
The same Grafana views still answer the questions I started with: short, medium and long-term views. Value compounded over time.
7 years of data in a single 1 MB dump. Automated via GitHub Actions. Restore takes seconds.
Home Assistant made it obsolete. Once per-appliance power sensors were in place (smart plugs, TIC interface), HA aggregates everything natively — long-term history included — without a dedicated stack.
7 years of data were migrated into Home Assistant as HP/HC energy statistics — fully visible in the HA energy dashboard, no data loss. The code stays on GitHub. The Grafana/MySQL instance is gone: no point running a separate stack when the IoT platform does the same job, better.
Pricing. Tariff tables (peak/off-peak, standing charge, taxes) change often, and are only published as PDFs.
I tried to auto-download and parse those PDFs. The tables were too irregular: parsing broke on every tariff revision.
I ended up hard-coding prices. Simple and robust, but wrong the moment a rate moves. A conscious trade-off: I'd rather have accurate kWh than a fake cost.
I could see total consumption falling. But what was actually using power? Impossible to know from a single meter.
I needed to go further: measure appliances individually. With a proper IoT platform, a community, serious hardware.
Enter Home Assistant.
Move to Home Assistant →References
-
[01]
Teleinfo Client (TIC) Specification, Enedis
The official spec for the serial protocol emitted by the Linky meter: frames, fields, legacy and standard modes. Without it, the signal is undecipherable.
-
[02]
hallard.me, Charles-Henri Hallard
The maker behind the PiTInfo / LibTeleinfo USB key. Where I bought the hardware and found the community that actually reads TIC frames in France. One of the few places where electronics and software meet on this topic.