Case study
Linkya · NILM
ML · Time-series · Signal processing
GitHubHome Assistant tracks everything, except the water heater, hardwired to the breaker panel with no smart plug possible. Linkya feeds the Linky signal into a Seq2Point NILM engine: draw the signatures, train, the heater emerges and publishes to HA. Blind spot closed.
Home Assistant measures everything with a smart plug: TV, laptop, fridge, oven, router. Consumption is covered, appliance by appliance, except what cannot be plugged in. 50% of my consumption is classified as 'Untracked'.
The water heater is the typical suspect: hardwired directly to the breaker panel, no way to slip a smart plug in. Current clamp sensors can measure without a plug, but require wiring access. As a tenant, that's off the table. And yet it runs several times a day, a few kilowatt-hours each cycle. It's probably my biggest single cost after winter heating, and I have no measurement of it.
NILM, Non-Intrusive Load Monitoring: infer each appliance's usage from the meter's aggregate signal alone.
I'm not an ML specialist: I'm an engineer. I cleared the path paired with AI, and it's engineering discipline that makes the result trustworthy. Working with AI →
Under the hood, Linkya implements a Seq2Point model on an LSTM/GRU architecture with an attention mechanism.
Still unclear? Simpler:
Seq2Point: feed the model a sequence (a window of a few minutes of the aggregate signal) and it answers with a single point: the appliance's power at the instant in the middle of that window.
LSTM / GRU: short memories. The model remembers what just happened, useful because a heating cycle is a ramp, then a plateau, then a drop: the sequence is the signature.
Attention: a spotlight. The model learns to focus on the moments that matter and ignore the rest.
In plain terms: imagine an ear learning to pick out one person's voice from a crowd. The Linky meter 'hears' the whole house at once. We show the model what the water heater sounds like when it runs, and it learns to spot it even when other appliances are drawing power at the same time.
Most NILM approaches train on public datasets (UK-DALE, RAE...) : foreign homes, generic appliances. The model knows an average water heater, not mine. Linkya trains on my home, my signatures, my real appliances. Any installation, any country. The trade-off: capture a few signatures upfront. That is what makes detection accurate where others approximate.
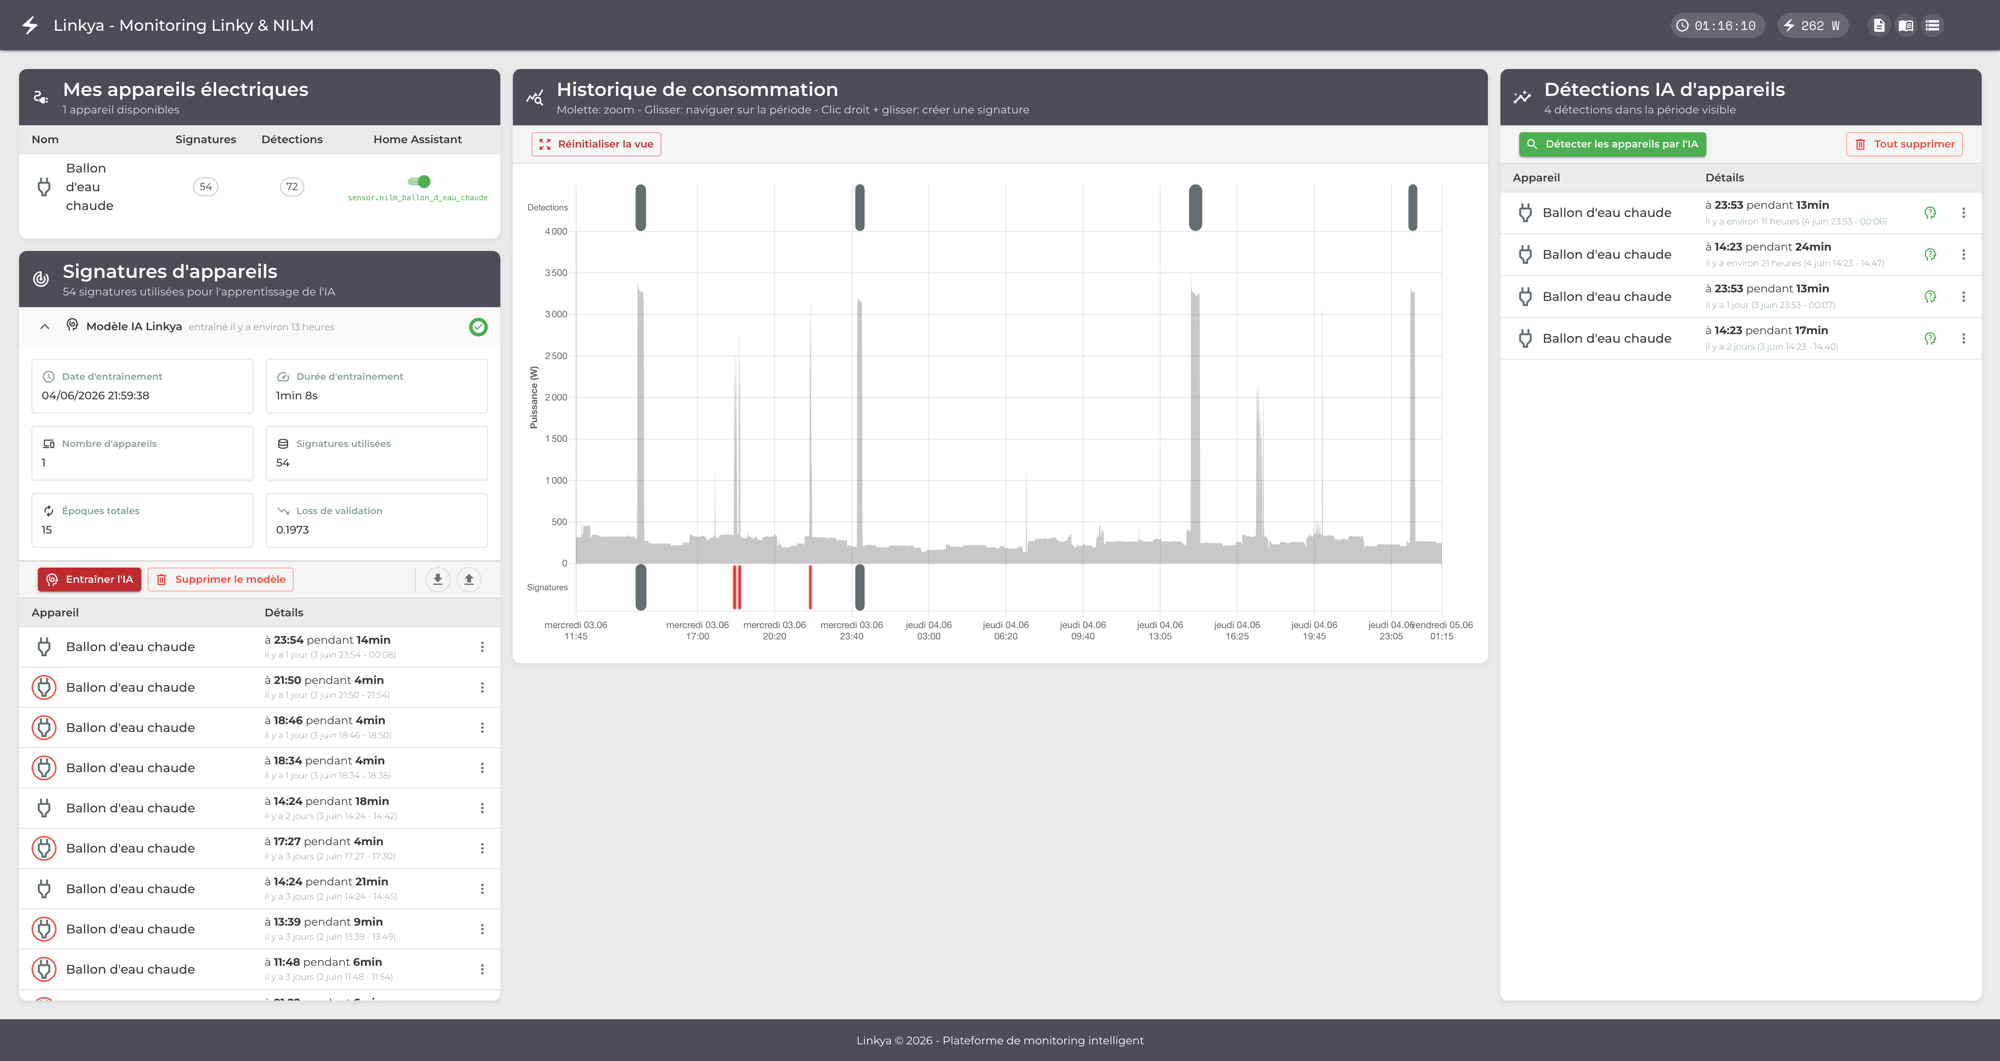
On the UX side, the goal was simple: visualise the global Linky signal over the last N days, zoom and scroll the curve easily to spot an appliance's operating windows: a regular power spike, a consistent start time (off-peak hours for the water heater).
Highlight the zones on the curve and assign them to the appliance.
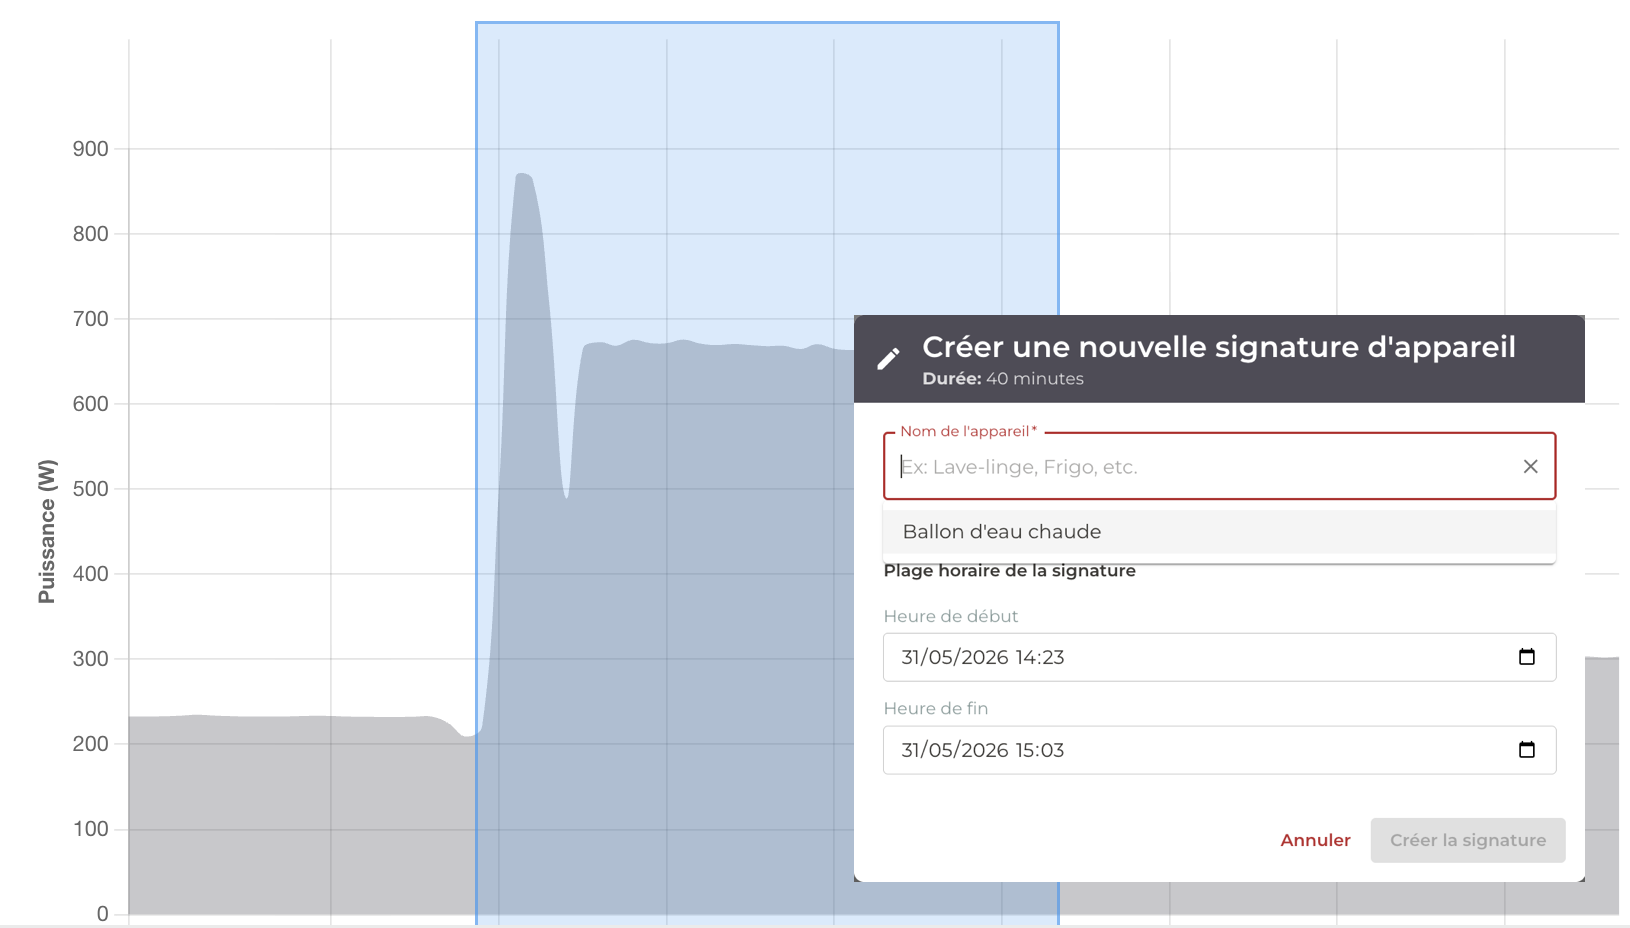
A few dozen signatures are enough for a first training run. The interface is built for it: capturing a cycle takes a few seconds.
We can then test detection on the rest of the curve and refine signatures as needed.
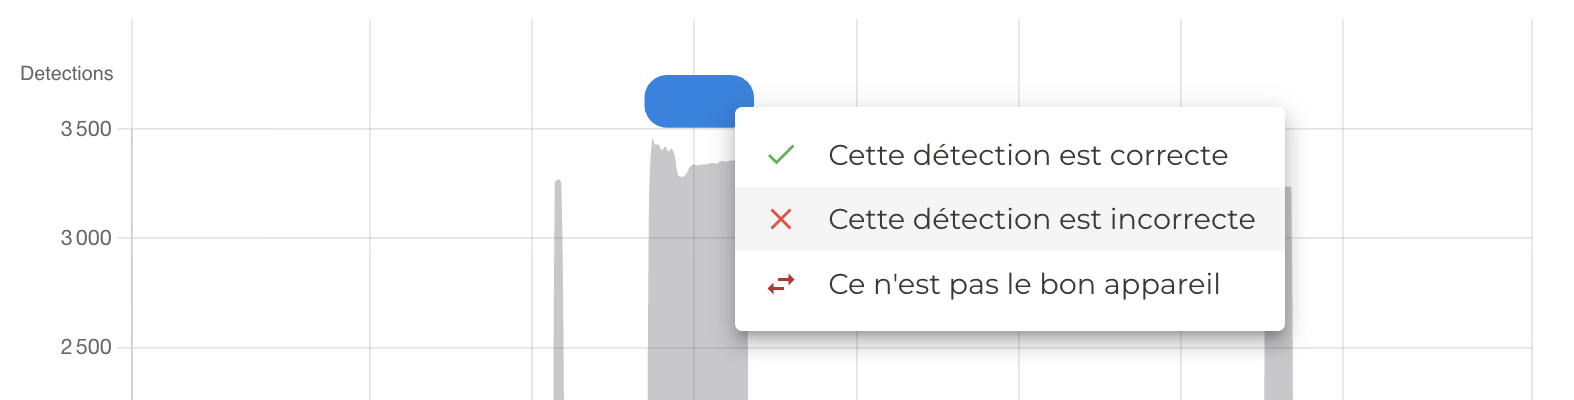
A correct detection can be validated by the user and turned into a 'positive' signature for the model: it learns to recognise the appliance more reliably in the Linky signal.
A bad detection can be invalidated by the user and turned into a 'negative' signature for the model: it learns not to confuse the water heater with something else.
In total I reach over 70 signatures in a few minutes. Enough for a stable model.
Once the model is satisfactory and the option enabled, Linkya detects continuously and publishes the appliance state directly to Home Assistant via MQTT.
The water heater cycles appear clearly at off-peak hours, as expected from the automatic timer. A few detections fall outside those windows: occasional reheats and probably one or two false positives. Nothing critical. If the rate climbs, a few extra signatures and a retraining run will fix it.
The blind spot is closed: activations, estimated consumption, time patterns. The entity appears in Home Assistant just like any other appliance.
Consumption from a non-connected appliance is now attributed.
Everything runs on the meter signal already captured. No new hardware, no wiring.
Every detection is scored against the reference signatures. The 30-day mean confidence is visible live.
My first target was deliberately simple: a water heater with a straightforward signature (a large steady plateau for several minutes).
Appliances with more complex and variable cycles (washing machine, dishwasher, oven, hob) are harder to detect. The model needs more signatures to reach stable detection.
For example, the same electric heater model in a bedroom, a guest room and an office: identical electrical signature. The model clearly sees a heater is on, but cannot tell which one.
That's NILM's real wall in general, not a Linkya bug: a physical constraint of the aggregate signal.
The question follows naturally: Linkya could become a native Home Assistant integration. Data comes from HA, detections go back to HA. The standalone app is just a middleman.
The one sticking point: the annotation UI. Selecting a time range on the power curve to capture a signature is straightforward in a standard web interface. Reproducing that experience as a custom Lovelace card with its own curve, JS, and style is a full rewrite. Feasibility to be assessed.
Linkya isn't a standalone project: it's one of the apps deployed on my self-hosted infra alongside Home Assistant and this site.
Same Raspberry Pi, same Docker Compose base as the rest. One more app behind the single front door.
See the infra →References
-
[01]
Hart, G.W. (1992). Nonintrusive appliance load monitoring
The founding NILM paper. Hart established the principle in 1992: detect load transitions in an aggregate signal to recover individual appliances. Thirty years later, the core approach is unchanged.
-
[02]
NILMTK, Non-Intrusive Load Monitoring Toolkit
The academic reference framework. I don't use it (designed for research, not for embedded deployment), but its benchmarks and datasets set my expectations for what's actually achievable.
-
[03]
Zhang et al. (2018). Sequence-to-Point Learning with Neural Networks for NILM
The reference paper for the Seq2Point model: a window of aggregate meter readings as input, a single appliance's power at the central point as output. The baseline architecture for Linkya.